There are very often questions on the Internet: why the computer reboots on its own, causing the device to freeze and turn off immediately, what to do if the monitor does not work stably.
The first thing you think about is the presence of viruses, but in most cases the problem is overheating of the processor or video card. In this article we will look at practical and easy-to-use software tools for displaying temperature indicators.
Why do you need to know the temperature of hardware parts?
The temperature of the processor or video card in operating condition is constantly changing. Overheating may cause your computer or laptop to suddenly shut down, resulting in data loss. Therefore, if you want to avoid critical temperatures and prevent equipment damage, you must use special software. With their help, you can monitor the temperature indicators of the heating of the processor, video card, and hard drive at the time of their operation.
Basic Tools
You can check the temperature by going into the BIOS. To do this, you need to restart the operating system; while turning on the computer, press the “F2” or “Delete” key, depending on the version of the device. After entering the BIOS, you need to find the “H/W Monitor” section and select it. After which, the temperature indicators of the hardware components will be displayed.

The main disadvantage is that there is no way to see the temperature while the computer is running and its load. Therefore, next we will look at the most useful software products.
HWMonitor
"HWMonitor" is a program for monitoring the temperature of the processor and video card. It also allows you to find out the fan speed and voltage data. This program can be downloaded from the official website.
- After launching the application, all main devices will be displayed: processor, hard drive, integrated and discrete video cards, laptop battery.

- Having opened all processor items, the current maximum and minimum temperature values collected during PC operation will be displayed. The following items relate to the processor: voltage, temperature, load level, as well as its frequency.

- About the hard drive, only its temperature is indicated.

- Next come integrated and discrete video cards. The program shows the temperature and frequency for the integrated one; in the discrete mode, load is displayed instead of frequency.

- The battery item is indicated only for a laptop; the voltage consumption, power and battery wear levels are displayed here.

AIDA 64 Extreme Edition

"AIDA 64 Extreme Edition" is an extensive complex of diagnostics and testing of computer hardware components. The program has many features:
- real-time monitoring of computer hardware and system components;
- computer hardware testing;
- diagnostics of components for problems and errors;
- analysis of systems and application programs;
- Monitoring temperature, voltage and fans.
It should be said that the program is paid. Its trial version is limited to 30 days of use - this is the main disadvantage.
This utility can be downloaded from the official website, let’s look at where to find computer temperature indicators:
- After installing the program, launch it by double-clicking on the shortcut.
- In the window that opens, double-click on the “Computer” item and select “Sensors” from the list that opens.
- Detailed information will open about all components of the computer equipped with a temperature sensor, including the main ones: “CPU” (Central Processing Unit) and “GPU” (Video Card).

MSI AfterBurner
MSI AfterBurner is a multifunctional utility that is aimed at monitoring video card performance. It is often used by gamers to overclock the graphics card and to monitor the following indicators:
- increasing memory clock speed;
- cooler rotation adjustment;
- FPS monitoring (a number indicating how many times per second the GPU updates the image);
- notification of increased critical temperature values.
You can download this program from the developers’ website using this link. Let's look at the main parameters of the program:

What to do if the temperature is elevated?
The normal temperature during operation of the processor is considered to be up to 60 degrees, for a video card - up to 80 degrees.
If you find a problem with devices overheating, then consider the primary solutions:
- First, turn off your computer or quit the program that is causing it to overheat.
- It is necessary to ensure good blowing of the coolers and completely clean the computer from dust.
- Decrease in ambient temperature. Often, high room temperature affects the temperature of the computer hardware. To get out of this situation, you can use an air conditioner or fan.
- Installation of a more powerful cooling system. Installing additional coolers for the processor and video card will solve the problem. You can also use stands for a device with a cooling system.
But the safest and most correct advice would be to take the computer to a service center for a full diagnosis and further repair or cleaning. This is where the review of tools ends. If you know more convenient and high-quality software solutions, write in the comments.
Monitoring the CPU and GPU are very important indicators to check the stability of the system as a whole. Overheating of the processor or graphics chip is fraught with consequences both for the stable operation of the system and for the failure of components.
Due to the large number of processors and video cards, developers have released many utilities that can monitor their thermal characteristics. In this material we will describe the most popular processor and video card monitoring utilities used in the Windows operating system.
First we will look at the utility. The utility is very popular among gamers, as it allows you to monitor the temperature of the processor and video card directly in the gaming application. The program was created by IObit, so you can download its installer for Windows on the official website www.iobit.com. Installation is reduced to a couple of clicks, so anyone can handle it. Having opened the program, we will be taken to the first tab “ Games».
We are interested in the second tab “ Temperature».

On the tab that opens, you can see that the temperature indicators and graph are displayed in Fahrenheit. To change the temperature to the familiar Celsius value, you need to go to the program settings and check the appropriate box, as shown in the figure below.

The advantages of the program include a beautiful interface and notification function when the processor overheats. For example, if you play a heavy game that puts a lot of stress on the processor and video card, it will notify you when they overheat.
Many users of personal computers are familiar with the program for testing, diagnosing and determining the characteristics of components EVEREST in Windows OS. Program EVEREST created by the efforts of Lavalys developers. Since 2010, Lavalys has released a successor to the utility EVEREST called AIDA64. To the utility AIDA64 all functionality included EVEREST, and new diagnostic and testing functions have been introduced. From us AIDA64 we need functionality that provides data on the thermal characteristics of the processor and video card. Download a free trial of AIDA64 or purchase it. After installation, launch the program.

In the window that opens, we see the rich functionality present in EVEREST, which allows you to check the system. We are interested in temperature, so let’s go to the tabs “ Computer/Sensors».

The tab that opens displays all the information about the sensors, as well as the temperature that these sensors output. In addition to the temperature of the processor and video card, you can also find out in this tab thermal characteristics of HDD and motherboard, and also find out information about the voltage of components.
If you need to identify a problem with a processor or video card, then in this case “ System stability test" You can run the test in the menu " Service».

This test loads the processor and graphics core, as a result of which they warm up to maximum temperatures. If the CPU or GPU is faulty, then this will identify the problematic device.
The example shows that the utility AIDA64 is a worthy successor EVEREST, with the help of which PC users can easily find out the temperature of components, as well as find out all the information about them and check them by performing diagnostics.
Another representative of obtaining computer characteristics and obtaining information from its sensors is the utility. The program is free and you can download it for Windows OS from the official website www.hwinfo.com. After installation, run the utility.

The utility has a simple and beautiful interface, but, unfortunately, does not have Russian language support. To open a window with indicators of all sensors in the system, you must click on the button " Sensors", which is located at the top of the window.

In the window that opens, you can view all data on the temperature of the processor and video card, as well as other components. In addition, this window displays information about the voltage of the components, as well as information about the frequency of the CPU and GPU.
While it's on, it's all maximum and minimum measurements of indicators from sensors are recorded. That's it for the window " Sensors"does not end. The user can customize the display of all information for himself, and also write logs of all readings to a text file.
A program for measuring processor temperature is a fairly popular tool for monitoring the thermal performance of computer components. The program was developed by CPUID, which became famous thanks to the release of the CPU-Z utility. Like CPU-Z, the one in question can be downloaded for Windows OS on the official website www.cpuid.com. By launching the program, the PC user will immediately see all the information taken from the sensors.

Just like in previous utilities, in addition to viewing the temperature and frequency of the CPU and GPU, the user can find out all the information about the voltage of the components.
The example shows that the main purpose is to conveniently view the information provided by computer component sensors. The user can also save all received readings to a text file.
Another program for viewing the characteristics of a computer and obtaining information from its sensors is the utility. The utility was created by the well-known company Piriform Ltd, which became famous for developing the CCleaner utility. Thanks to the company's fame, the new utility has already managed to gain popularity among thousands of PC users. You can download the utility for Windows OS from the official website www.piriform.com. After launching, it will scan the system and display all information about the temperature of the processor and video card in its window.

In addition to thermal indicators, it will show all information about components and operating system. To find out more detailed information, for example, about a video card, you just need to click on the corresponding tab.

From the example it is clear that the utility is very convenient and has a beautiful and understandable interface.
Also note that the utility can save all received readings, both in a text file and in a special snapshot file. This snapshot is for viewing the acquired data on another computer using Speccy.
From the English name of the utility you can understand what its purpose is. It is distributed free of charge and can be downloaded for Windows OS on the official website www.wisecleaner.com. After launching the utility, it will be built into the notification area and display a pop-up window in which you can see the CPU temperature.

Having opened the main program window, we will immediately be taken to the “ Processes" We are interested in the tab " Hardware”, which is incorrectly translated into Russian. In the English version, the tab is called “ Hardware Monitor", which can be translated as hardware monitoring. By going to the tab " Hardware", we will be taken to a general description of the system. To view information about the processor temperature, you need to click on the left tab “ CPU».

By clicking on the tab " Graphics card", we will find out all the information about the video card, as well as its temperature.

The example shows that the utility has a convenient and beautiful interface and provides the PC user with maximum information. In addition, the program has built-in support center, where you can ask questions about the biting operation of the utility and the information it produces.
GPU-Z
Utility GPU-Z created by the Internet portal www.techpowerup.com. You can download the installer for Windows on the same portal. The main purpose of the utility is to display information about the graphics device, as well as display and record data from the video card sensors. After launch GPU-Z we will immediately receive all the information about the characteristics of the video adapter.

On the " Sensors"You can find out the temperature of the video card and find out the frequency of the graphics chip.

Also on this tab you can control changes in the dark characteristics of the video adapter.
Utility GPU-Z is very popular among many PC users and overclockers. The utility gained such popularity due to the provision of accurate information about the video adapter, as well as the ability to save the GPU BIOS.
In this article, we looked at seven popular utilities with which any computer user using the Windows operating system can obtain information about the temperature indicators of both the processor and video card. For continuous monitoring of temperature values, you can also install it on the desktop of your PC.
Controlling and monitoring the thermal performance of computer components will help you prevent their breakdown. Also, the normal temperature of the CPU and GPU contributes to the normal operation of the system and its stability, which cannot be said about overheating components.
By learning about overheating components, the user can prevent their breakdown in advance.
We hope our material will help you take temperature readings from your processor and video card, and will also allow you to prevent them from overheating.
Video on the topic
Then you need to measure their temperature from time to time to make sure that it is within normal limits. If you do not do this, then over time the processor and video card will begin to overheat. Most often this happens due to dust accumulated in the computer, but there may be other reasons, for example, dry thermal paste. Now we will look at a number of free programs for measuring the temperature of the processor and video card that you can use to solve this problem.
is a free program for . With its help, you can change such video card parameters as chip voltage, energy consumption limit, graphics chip clock speed, video memory clock speed and cooler rotation speed. But, in addition, this program allows you to measure the temperature of the processor and video card directly in computer games.
To do this, you need to go to the program settings and enable the display of these parameters on the screen there. After this, you just need to launch any game and watch the temperature, information about which will appear in the upper left corner of the screen.
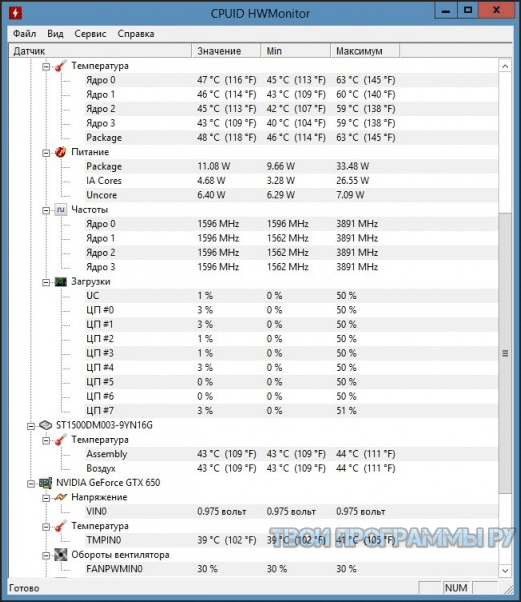
is one of the best free programs for measuring computer temperature. With it you can measure the temperature of the processor, video card, hard drives and motherboard. This program is developed by CPUID, also known for its CPU-Z program.

In addition to temperature information, the HWMonitor program collects all other data from hardware sensors and displays this information in a user-friendly form. For example, in addition to temperature, this program displays information about voltages, cooler rotation speeds and load levels.
You can download the CPUID HWMonitor program.
is a free measurement program. Core Temp is designed specifically to measure CPU temperature, so it has a number of highly specialized functions. For example, using Core Temp you can display information about the processor temperature on the taskbar. This will allow you to monitor the temperature during operation.

In addition to temperature, using Core Temp you can find out the voltage on the processor, the energy consumption of the processor, as well as all the main characteristics of the processor (processor model, platform, clock speed, number of cores, technical process, etc.).
You can download the Core Temp program.
is a free program for obtaining computer information from Piriform, better known as the developer of CCleaner. The Speccy program collects a lot of various information about your computer and displays it in an easy-to-study form. Among other things, using Speccy you can measure the temperature of the processor and video card.

To obtain information about the processor temperature, you need to open the “Central Processor” section of the program. In this section, all technical information about the processor will be available, and at the very bottom there will be a table with temperatures. Information about the video card is available in the “Graphics devices” section.
You can download the Piriform Speccy program.
– a free program for obtaining information about a video card. With its help, you can find out all the main technical characteristics of the video card, as well as measure it, find out the current frequency, load level, cooler rotation speeds, etc.

In order to measure the temperature of the video card, after startup you just need to go to the “Sensors” tab and observe the “Temperature” parameter. If necessary, the video card temperature can be displayed in the GPU-Z window title or in a LOG file.
You can download the TechPowerUp GPU-Z program.
is another free program from CPUID. Perfmonitor 2 is designed to measure the temperature of the processor, as well as to collect other data about its operation. For example, using this program you can find out the load on the processor, as well as the number of instructions executed for each watt of energy spent.

At the same time, Perfmonitor 2, like the Core Temp program, can display information about the processor temperature on the taskbar.
Rate the program
(2 879 ratings, average: 5,00 out of 5)
Our review presents free programs for monitoring the temperature of the video card and processor, which will help you avoid critical indicators and overheating, which lead to unstable operation and damage to the equipment.

The functionality of applications for monitoring the physical parameters of PC components provides detailed information about them, signals critical parameters, adjusts fan speed and makes other fine adjustments. A selection of the best programs for checking the temperature of a video card and processor will help you familiarize yourself with the capabilities of the utilities in question and choose the most worthy one for yourself.
Programs |
Russian language |
License |
Rating |
CPU temperature
|
Video card temperature |
| Yes | Free | 8 | Yes | Yes | |
| Yes | Free | 10 | Yes | Yes | |
| Yes | Free | 7 | Yes | Yes | |
| Yes | Free | 10 | Yes | Yes | |
| Yes | Free | 10 | Yes | Yes | |
| Yes | Free | 8 | Yes | Yes | |
| Yes | Free | 10 | Yes | Yes | |
| Yes | Free | 10 | Yes | Yes | |
| Yes | Free | 8 | Yes | Yes |
The application displays data from ATI, NVIDIA cards and the graphics adapter, analyzes technical parameters, determines the operating speed and temperature of the fan, and displays detailed information about the video card (model, name, type, version, frequencies, memory size, etc.). The “Certification” option allows you to save all frequencies obtained during overclocking and analyze their operation. The interface is clear with the menu in Russian.

A free, high-quality program whose functionality allows you to monitor the temperature of the processor, disks and other system characteristics. The software tools will help the user monitor fan speeds, analyze hard drives, adjust motherboard frequencies and voltage, and create graphical data of changes. Using the “Events” option, you can set up notifications about changes in indicators above the permissible norm via a pop-up window, a sound signal, or an email. An important useful function of SpeedFan is adjusting the cooler speed, system bus frequency and noise.

This quality application evaluates and overclocks your video card and has settings at the lowest level. The functionality allows you to unlock blocks of graphical processes, configure the cooling system and fan speed, and also fine-tune each individual application from the “firewood” level to the low-level approach to the equipment. For experienced users, the functions of a patch script interpreter and a registry editor have been introduced, and a unique hardware monitoring and diagnostic system allows you to adjust fine settings in real time. The software is distributed free of charge and has a Russian-language interface.

![]()
Useful software for analyzing the physical parameters of PC components. Presents the user with branched characteristics of components, shows current, minimum and maximum permissible values. It is possible to export the analysis to a text format for further comparison with previous indicators and their stabilization. The application nuclearly deciphers indicators and diagnoses modern models of video cards and power supplies. By default, the interface is in English, but you can install a localization language.
The program displays the passport data and current characteristics of the equipment installed on the computer. Functionality allows you to monitor the temperature, frequencies of the video card and processor cores, used memory resources and system components. The application can export reports to test files and publish them on the Internet, support peripheral and network components, and structure materials into blocks. The interface is Russian-language and not complicated.

The utility checks removable drives, the system as a whole, and hardware. This quality upgrader can improve machine performance through powerful and in-depth scanning, diagnosing problems and errors, and selecting different testing options. AIDA64 collects system data, detects and analyzes errors, determines the stability and performance of memory, processor and hard drives. In addition, the software can measure voltage, fan temperature, test the processor and memory, and also show a report on installed software. The free version of the program works for 30 days. 
![]()
Fresh Diagnose is a free application that allows you to test your PC and analyze its performance. Diagnoses peripheral devices, network, installed software and computer components. The program works only on computers with 32-bit Windows OS, has an accessible interface and Russian menu language. Fresh Diagnosis analyzes the performance of video cards, processors, hard drives, motherboards, etc. After the scanning process, the resulting material can be compared with data from other systems that, in your opinion, are more advanced. 
![]()
MSI Afterburner is a free program for overclocking a video card, monitoring and adjusting it. Active gamers know how high the demands on a computer can be for the newest and top games. If you download MSI Afterburner for free onto your computer, you can “adjust” the video card parameters to the desired parameters.

![]()
CPU-Z is a free utility that provides information about the technical characteristics of PC components and is useful for overclocking processors. The program provides information about RAM, video card, motherboard and processor. Downloading CPU-Z for free on your computer will be useful for overlockers, advanced users and those who are interested in how PC system components work.

SpeedFan is a utility that dynamically takes temperature readings from sensors built into the video card, motherboard, disks and other equipment, maintaining acceptable temperature conditions by maintaining a certain number of revolutions per minute (RPM) of coolers in the PC cooling system. To get a powerful tool for diagnosing problems and monitoring performance, heat dissipation and noise, we recommend downloading the SpeedFan utility for free in the Russian version via a link from the website without registration and SMS. SpeedFan can interact with all common temperature monitoring chips for PC components and smart coolers.
For many users, a real find will be a program for monitoring the overheating of computer components (CPU, GPU, HDD, MB chipset, power supply and other components) located inside the PC case. If the degrees Celsius of your computer rise for unknown reasons, we recommend downloading Russian SpeedFan for free for Windows XP, Vista, 7, 8, 8.1, 10. A program for adjusting fan speed automatically or according to user-specified parameters controls the heating of the video card, processor, hard drive, and motherboard chipset , power supply and other components by setting a certain value for the rotation speed of coolers of cooling systems.
Interface and advantages of the SpeedFan utility
The SpeedFan interface in Russian, despite the large amount of information, is simple and understandable. When the default is English, switching from English to Russian is not difficult. This is done through the Configure button, in the Language checkbox of the Options tab. Simple interface elements such as indicators help you instantly deal with a situation when it threatens to get out of control.
It is worth downloading SpeedFan for free in order to monitor temperature changes in your computer to get a convenient means of displaying the values of temperature sensors and fan speeds. All parameters can be easily converted into a chart or graph. Constant monitoring of heating and cooling system performance allows you to control performance on the one hand, and noise emanating from the system unit on the other.
Use the opportunity today to download the latest version of the SpeedFan program for Windows 10, 8.1, 7, Vista, XP to get the following benefits:
- dynamic change in cooler speed,
- correction of bus frequencies on compatible motherboards,
- support for S.M.A.R.T technology with consideration of HDD errors,
- maintaining data statistics and logging,
- displaying graphs and diagrams of the dynamics of voltages, temperatures and cooler speeds.
Functionality of SpeedFan
Despite its small size, the SpeedFan program is endowed with powerful functionality and can cope with the most problematic situations related to overheating inside the case of a computer, laptop or netbook. The program automatically, within the programmed parameters, increases airflow when the component heats up or reduces the fan speed at lower loads to reduce noise.
The following information is used to monitor and control performance:
- processor temperature (CPU),
- CPU cooler RPM,
- heating of the graphics processor (GPU),
- speed of rotation of the heat dissipation unit of the graphics processor (GPU),
- warming up the hard drive (HDD),
- rpm of fans of the hard disk drive (HDD) cooling system,
- overheating of microcircuits on the motherboard (MB),
- performance of the cooling unit on the motherboard (MB),
- information on voltage and temperature of the power supply unit (PSU),
- number of revolutions per minute of fans in the power supply (PSU),
- readings of other sensors and cooling systems.
In addition to current data in real time, it is possible to construct corresponding charts and graphs over time.
Use cases for SpeedFan
If the question arises of how to increase the speed of a processor cooler or make a laptop fan spin faster, the SpeedFan cooler control program, Russian version, can be downloaded for free, which can be downloaded without leaving the site without registration. With this small cooler management utility, temperature control of the processor, graphics card and hard drive will be accessible even to an inexperienced user. You can use SpeedFan both at the user level and at the expert level. The program is successfully used in finding the causes of breakdowns, to increase productivity and reduce noise, and helps prevent overheating and equipment failure. Advanced capabilities for professionals are indispensable for load testing, testing computer components and testing non-standard configurations. Monitoring the temperature in real time and controlling the speed of rotation of all coolers inside the system unit is extremely necessary when overclocking. It is difficult to find such a simple and convenient tool for checking the stability of a computer as SpeedFan, which monitors sensor readings and rotation speed in the computer in real time.
It is enough to download SpeedFan for free in Russian for Windows 10, 8.1, 7, Vista, XP, install the utility on your computer and the application will take control of all components of the computer, naturally, within the limits of what is permitted. The program for controlling SpeedFan coolers can work both in default mode and with advanced settings. The user can program a change in state or certain events, for example, such as entering a range, overheating, or decreasing relative to a given temperature range or speed. When a certain event occurs, SpeedFan launches an application program, displays a text message, signals or sends an email notification.